


Next: Induced magnetic moment
Up: Calculation of eddy currents
Previous: Magnetic field
Contents
Eddy currents
The experimental setup consists of a big condenser battery, which powers the field coil described in section  . The discharge of the condenser batteries runs through an RLC oscillator and the field coils, which generate the magnetic field. The magnetic field as a function of time is shown in figure 10 for a typical discharging process. It has (approximately) the shape of a damped sine. Thus, it seems to be sensible, if we make a time harmonic analysis and compare the results with the pulse field experiments. The magnetic field reaches a maximum value of 5.23 T and a minimum value of 4.29 T. The time from the beginning until the end of the sinusoidally varying field is approximately 0.008864 s, which corresponds to a frequency of 112 Hz.
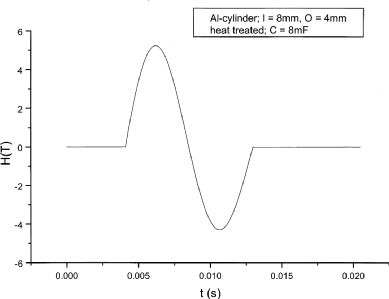
Figure  : Magnetic field due to a current pulse in the field coil
Sample Cu1 (cylindrical)
In the experiment with the above given field, a magnetization of 94 kA/m was found at the maximum of the field.
Single turn coil
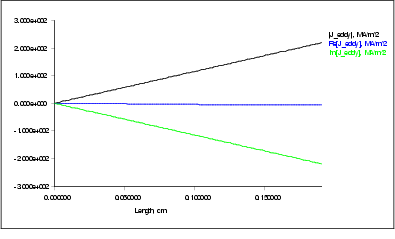
Figure  : Complex eddy current density as a function of radial distance from axis
At a frequency of 112 Hz the maximum current density is jmax = 218.8329 MA/m2 and gives a magnetization of M = 109.41645 kA/m. (See the following sections on how the magnetization is calculated.)
Coil model
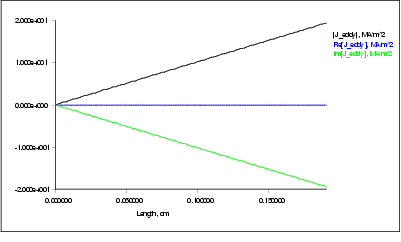
Figure  : Complex eddy current density as a function of radial distance from axis (10 Hz)
At a frequency of 10 Hz the maximum current density is jmax = 19.43746 MA/m2 and gives a magnetization of M = 9.71873 kA/m.
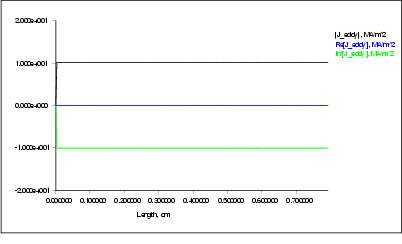
Figure  : Complex eddy current density at a constant distance of 0.1 cm from axis (10 Hz)
It is clearly seen, that the eddy current density does not vary with the position along the symmetry axis.
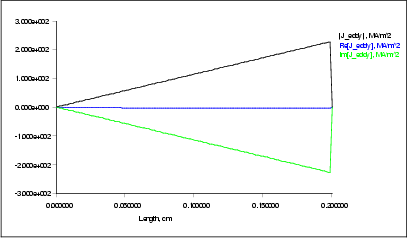
Figure  : Complex eddy current density as a function of radial distance from axis (112 Hz)
At a frequency of 112 Hz the maximum current density is jmax = 227.5316 MA/m2 and gives a magnetization of M = 113.7658 kA/m.
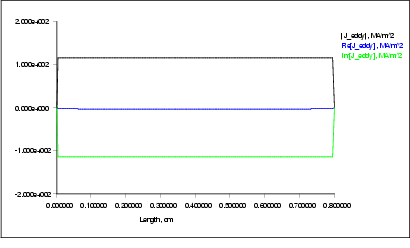
Figure  : Complex eddy current density at a constant distance of 0.1 cm from axis
High resolution mesh
Sample Cu1, 112 Hz
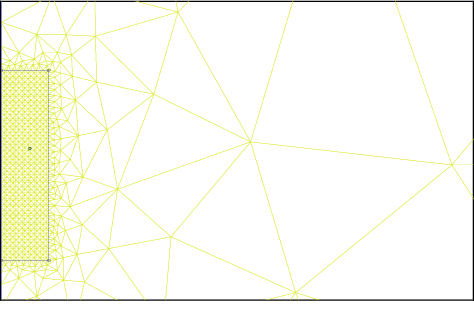
Figure  : High resolution mesh of the cylindrical sample
The mesh consists of 6363 nodes and 12434 elements. A small portion is shown in figure 19.
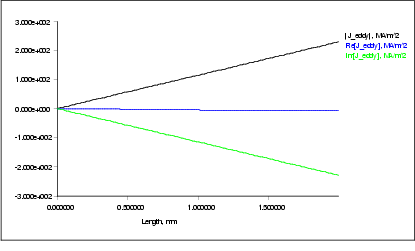
Figure  : Complex eddy current density as a function of radial distance from axis
Figure 20 shows the perfectly linear dependence of the eddy current density on the radial distance from the symmetry axis. At the symmetry axis the eddy currents vanish, and at the circumference they reach a maximum. The amplitude of the complex eddy current is found as (-5.180091, 228.7667) MA/m2. Thus, the phase difference between the current in the field coil and the eddy current is -88,70° and the eddy currents lead the coil currents by about a quarter phase. The absolute value of the eddy currents is 228.8253 MA/m2, which is in good agreement with the coarse mesh used in section 9.1.2.
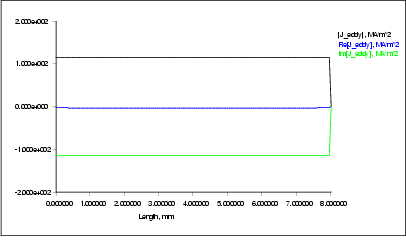
Figure  : Complex eddy current density at constant distance from axis
Figure 15 proves, that the eddy current density is perfectly constant parallel to the symmetry axis.
Sample Al3 (spherical)
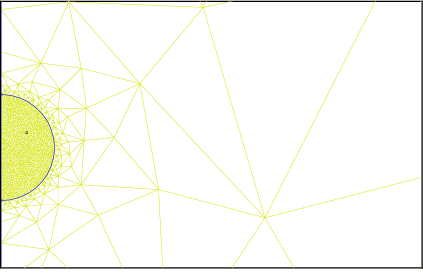
Figure  : High resolution mesh of the spherical sample
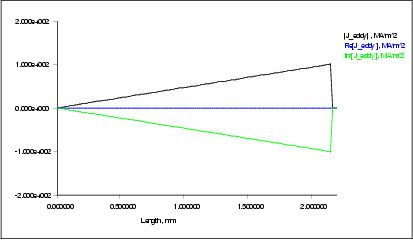
Figure  : Complex eddy current density as a function of radial distance from axis (centre of the sphere)
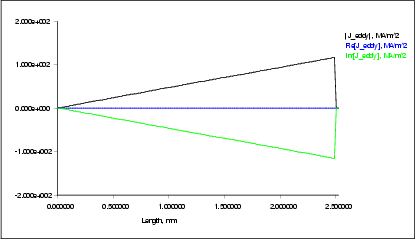
Figure  : Complex eddy current density as a function of radial distance from axis (at r=1.25 mm)
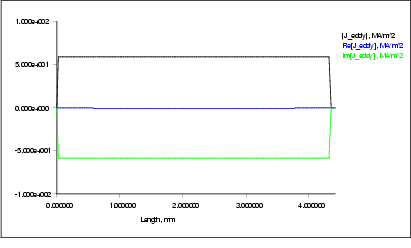
Figure  : Complex eddy current density at constant distance from axis (1.25 mm)
Sample Cu3
7477 nodes, 14660 elements
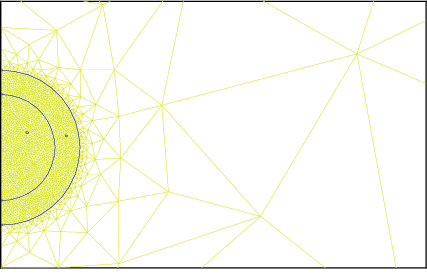
Figure  : High resolution mesh of the spherical sample
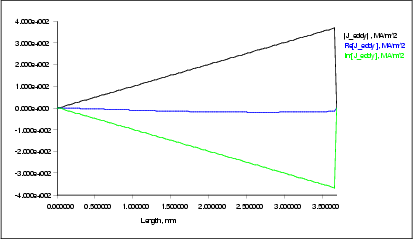
Figure  : Complex eddy current density as a function of radial distance from axis (centre of the sphere)
Comparison of experimental and numerical results
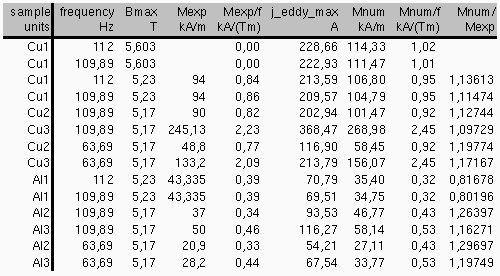
Table  : Comparison of experimental and numerical results
The agreement betwen experimental and numerical results is good for both cylindrical (Cu1, Cu2, Al1, Al2) and spherical (Cu3, Al3) samples.


Next: Induced magnetic moment
Up: Calculation of eddy currents
Previous: Magnetic field
Contents
© 1999
Werner Scholz
werner.scholz (at) tuwien.ac.at
 . The discharge of the condenser batteries runs through an RLC oscillator and the field coils, which generate the magnetic field. The magnetic field as a function of time is shown in figure 10 for a typical discharging process. It has (approximately) the shape of a damped sine. Thus, it seems to be sensible, if we make a time harmonic analysis and compare the results with the pulse field experiments. The magnetic field reaches a maximum value of 5.23 T and a minimum value of 4.29 T. The time from the beginning until the end of the sinusoidally varying field is approximately 0.008864 s, which corresponds to a frequency of 112 Hz.

 : Magnetic field due to a current pulse in the field coil

 : Complex eddy current density as a function of radial distance from axis

 : Complex eddy current density as a function of radial distance from axis (10 Hz)

 : Complex eddy current density at a constant distance of 0.1 cm from axis (10 Hz)

 : Complex eddy current density as a function of radial distance from axis (112 Hz)

 : Complex eddy current density at a constant distance of 0.1 cm from axis

 : High resolution mesh of the cylindrical sample

 : Complex eddy current density as a function of radial distance from axis

 : Complex eddy current density at constant distance from axis

 : High resolution mesh of the spherical sample

 : Complex eddy current density as a function of radial distance from axis (centre of the sphere)

 : Complex eddy current density as a function of radial distance from axis (at r=1.25 mm)

 : Complex eddy current density at constant distance from axis (1.25 mm)

 : High resolution mesh of the spherical sample

 : Complex eddy current density as a function of radial distance from axis (centre of the sphere)

 : Comparison of experimental and numerical results